Each image is a Gaussian distribution in a learned 2D perceptual space. On every trial the observer draws one sample per image and picks the candidate whose sample lies closer to the reference sample. Move x₀, x₁ or the reference r and the choice probability updates.
Background
Keys: 1 / 2 / 3 select r / x₀ / x₁, arrows move it
Which one is closer to the reference?
x₀
r
x₁
Pr(x₀ picked)
--
Pr(x₁ picked)
--
Distance difference per trial, D₁ − D₀
◀ x₁ closerd′ --x₀ closer ▶
Real BAPPS triplets
The demo runs the N = 2 observer model fit on BAPPS with CORnet-S Multi features, the model in Fig. 4 of the paper. Image positions are the means μ(x) and the ellipses are 2σ contours of Σ(x). The covariance MLP predicts Σ from μ, so an ellipse changes shape as you drag it. After an image leaves its original position, its card shows the BAPPS validation image whose μ is nearest to the new position. Probabilities use 4,000 Monte Carlo trials. The noise slider scales every covariance; the fitted model is 1×.
Each trial below is a real BAPPS triplet. The model encodes the three images, places them in the 3D perceptual space fit on BAPPS, and repeats the noisy comparison trial after trial.
Drag to rotate
Mean, z-scored
Pr(x₀ picked)
--
Pr(x₁ picked)
--
Distance difference per trial, D₁ − D₀
◀ x₁ closerd′ --x₀ closer ▶
Trials are drawn at random from the BAPPS validation set, five from each distortion type. The model is CORnet-S Multi at its saturating dimensionality on BAPPS, n* = 3 (Table 2 of the paper). The 3D view shows the full space, rotated to its principal directions after scaling each dimension by αm1/p. Lines connect the three samples of one trial, and the winner is decided by the weighted Minkowski distance. Probabilities use 4,000 Monte Carlo trials, of which the animation shows the first 40.
Abstract
Judging image quality is not only ecologically relevant to everyday humans tasks, but also underpins many machine vision tasks such as image generation. This paper proposes a framework to understand the inherent perceptual space underlying image quality judgment in humans. We propose a multi-dimensional observer model that represents images as distributions in a latent perceptual space and that models human judgment as comparing noisy samples. Being constrained by neural representations in the primate ventral stream and fit to large-scale behavioral data, the model enables analysis of perceptual structure while matching the predictive power of existing metrics. Using this model, we find that the perceptual spaces needed to account for image quality judgment in humans are extremely low-dimensional compared to the image space even when considering its sparsity. The exact structure of the space (e.g., dimensionalities, information encoded) varies between low-level and high-level quality judgments, suggesting that, despite a shared retinal encoding in the beginning, humans selectively construct task-dependent perceptual spaces in visual decision making.
Observer model
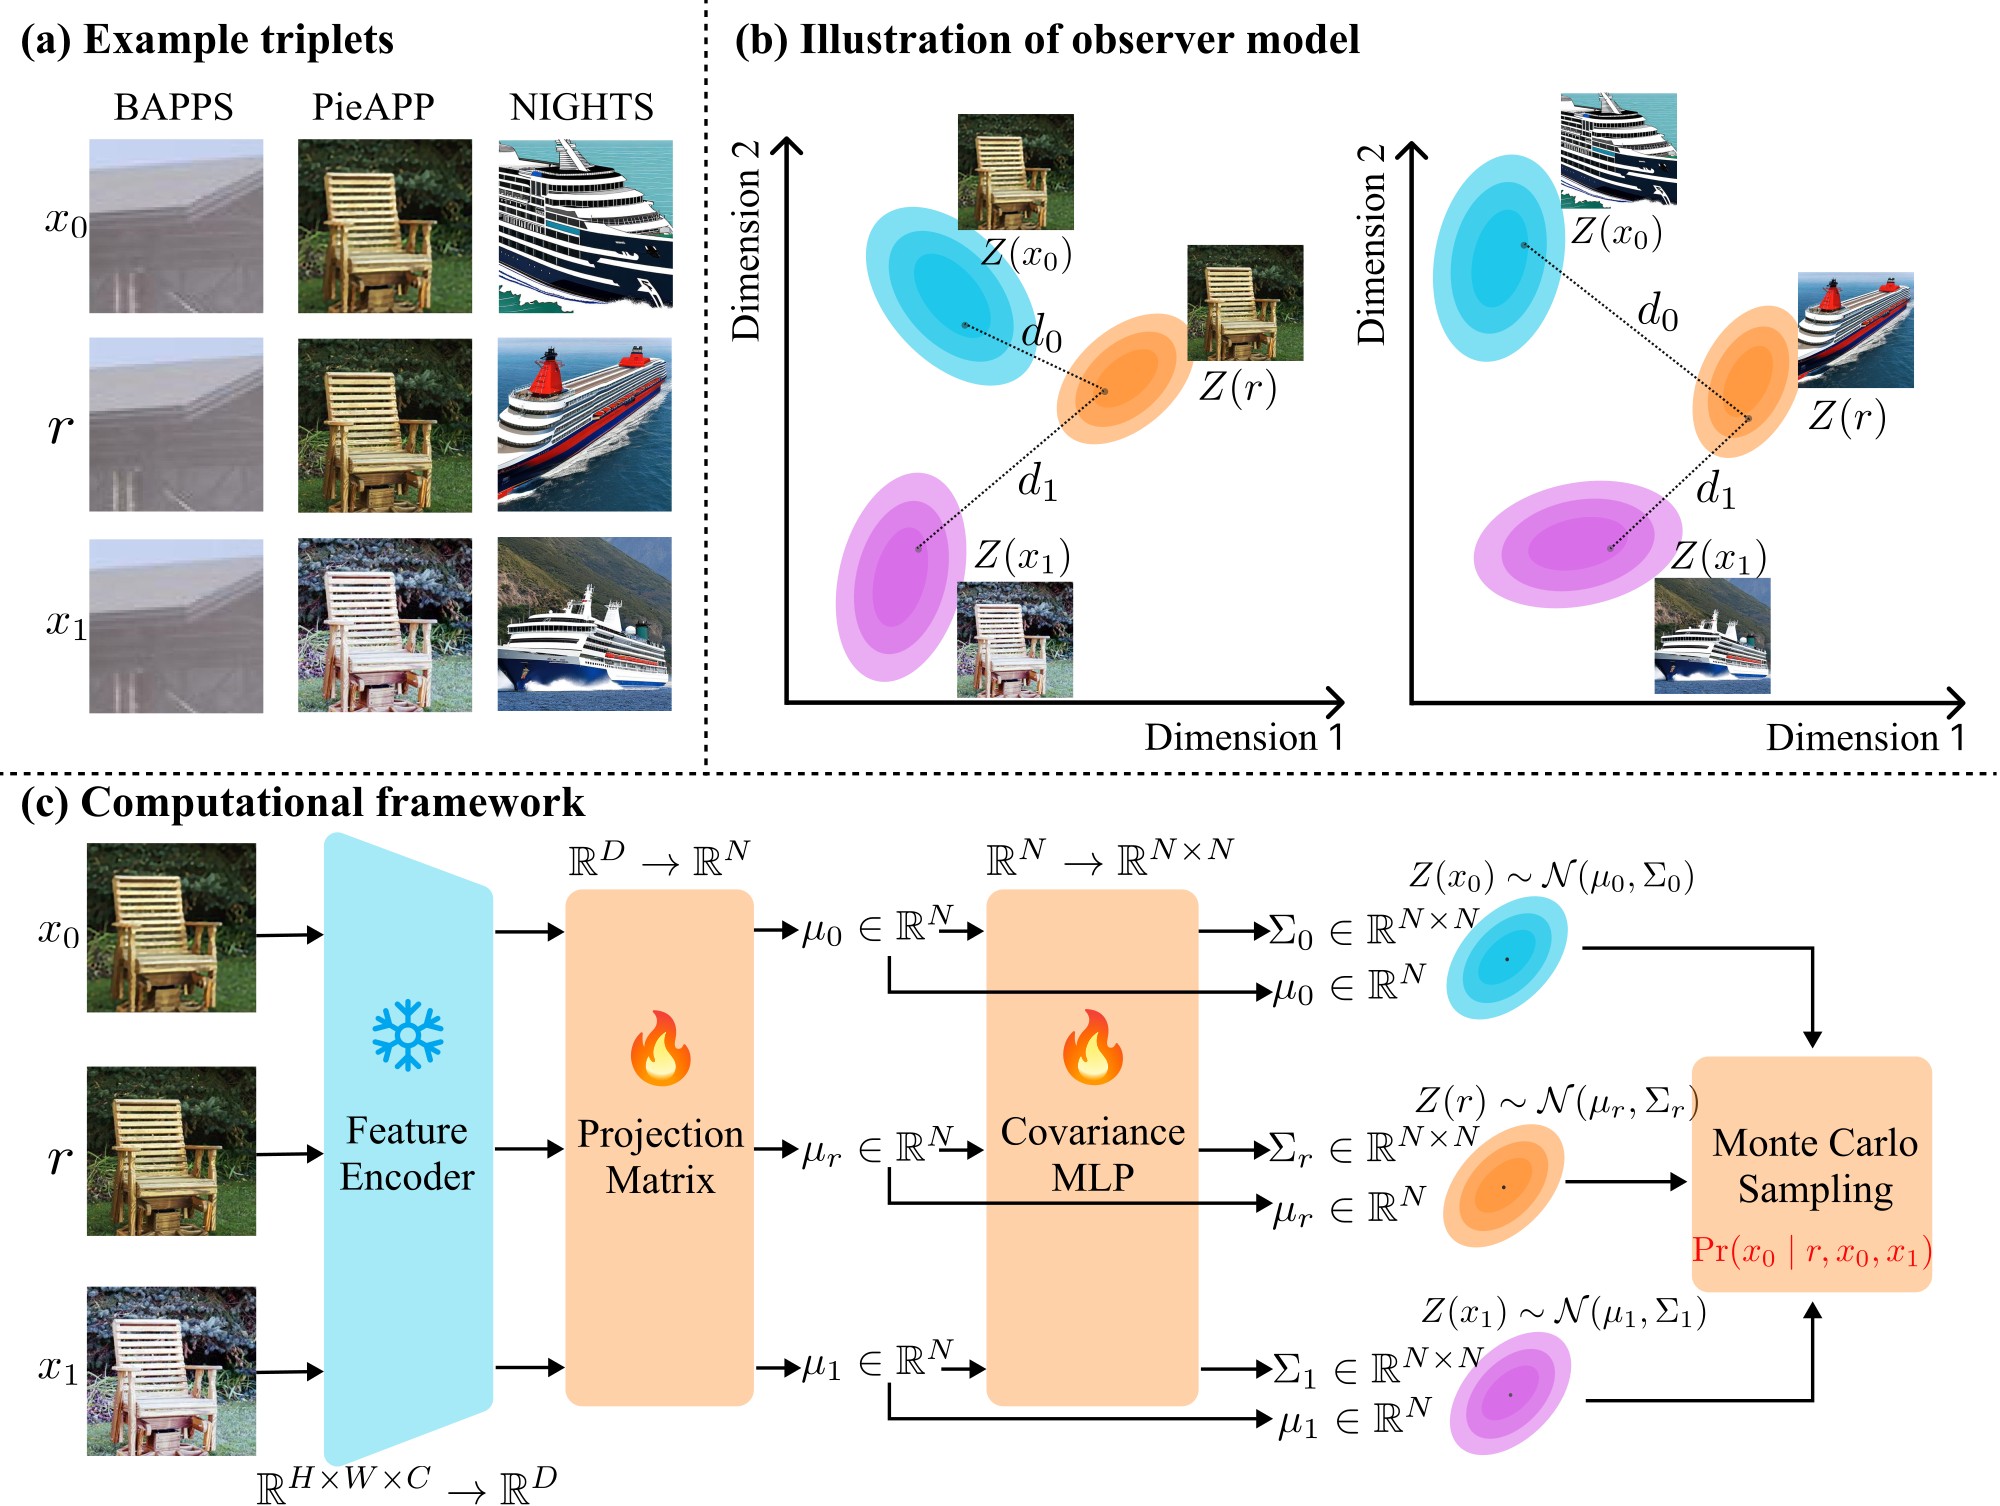
We encode each image x as a random variable in an N-dimensional perceptual space. The covariance depends on x, so different images are permitted to carry different amounts of perceptual ambiguity.
Each trial of a triplet 2AFC task presents a reference r and two alternatives x₀ and x₁. On any given trial, the observer draws a sample from each of the three distributions and picks x₀ if its sample is closer to the reference sample. We measure the distance with the weighted Minkowski distance:
The choice on one trial is the indicator 1{d₀ < d₁}. Its expected value is the probability that x₀ is picked, which we estimate with K Monte Carlo trials:
We encode x with a frozen encoder B(·) aligned with human visual processing: the four blocks of CORnet-S, which align with areas V1, V2, V4 and IT of the primate ventral stream, or a contrast pyramid that approximates retinal processing. The mean is a linear projection of the encoding, and a small MLP Gψ maps the mean to the Cholesky factor of the covariance:
We fit W, b, Gψ, α and p by maximum likelihood on human 2AFC data, using a straight-through estimator for the indicator and the reparameterization trick for the samples.
Overview of the observer model. (a) Example triplets (reference r and the two alternatives x₀ and x₁) from the three 2AFC datasets we evaluate. (b) Each image is modeled as an N-dimensional Gaussian random variable in an internal perceptual space; each observation draws a sample from the three distributions, and the candidate closer to the reference is picked in that trial. (c) The computational framework for the observer model.
Our observer model predicts human 2AFC choices accurately
Our goal is to probe the human perceptual space of quality judgment. To serve as a reliable tool for this purpose, the model must also be competitive with existing perceptual metrics. With CORnet-S Multi as the encoder, our model reaches 0.688 agreement on BAPPS, outperforming all baselines. On PieAPP it narrowly trails the best method and is within 0.056 of the theoretical ceiling. On NIGHTS it essentially ties with DISTS and falls only behind DreamSim, which uses modern foundation models. On KL divergence, our model performs best on BAPPS and is second on PieAPP.
Choice probability
MOS / DMOS
Embedding distance
Classical
Dataset
Ceiling ± 95% CI
Ours (CORnet-S Multi)
CVVDP
PieAPP
DISTS
TOPIQ-FR
MILO
DreamSim
OpenCLIP
DINOv3
CLIP
LPIPS
SSIM
PSNR
BAPPS (Agr ↑)
.797±.183
.688
.645
.629
.678
.667
.634
.683
.653
.640
.624
.662
.641
.633
cnn
.885±.112
.831
.809
.765
.813
.808
.800
.825
.800
.796
.773
.814
.809
.801
color
.764±.212
.634
.610
.612
.615
.616
.596
.627
.578
.572
.560
.588
.624
.624
deblur
.740±.224
.596
.594
.547
.599
.599
.584
.591
.560
.572
.539
.573
.594
.590
frame interp.
.760±.208
.621
.590
.606
.626
.610
.558
.632
.611
.613
.593
.627
.555
.543
super-res
.801±.181
.697
.658
.619
.692
.686
.645
.695
.670
.624
.627
.690
.649
.642
traditional
.858±.135
.790
.609
.703
.749
.695
.614
.771
.744
.734
.716
.714
.600
.573
BAPPS (KL ↓)
–
.170
.265
.236
–
–
–
–
–
–
–
–
–
–
PieAPP (Agr ↑)
.766±.105
.710
.591
.717
.690
.651
.616
.719
.661
.651
.671
.640
.584
.584
PieAPP (KL ↓)
–
.088
.985
.083
–
–
–
–
–
–
–
–
–
–
NIGHTS (Acc ↑)
1.000±0
.859
.703
.629
.860
.633
.621
.957
.848
.851
.837
.745
.621
.569
Agreement (Agr) for BAPPS and PieAPP, accuracy (1 − BER) for NIGHTS, KL divergence for models that output choice probabilities. Ceilings are followed by their per-triplet 95% CI averaged over all triplets. Bold = best, underline = second and third best. Numbers are from Table 1 of the paper.
Extremely low-dimensional perceptual spaces account for human judgment
For each encoder and dataset we sweep the perceptual dimensionality N. The saturation point n* is the smallest N at which the model explains 95% of its own above-chance performance. On both low-level datasets (BAPPS and PieAPP), the saturating dimensionality is generally around 5. On the high-level dataset (NIGHTS), where images differ in mid-level and semantic properties, it is about 10× higher and reaches 96 at IT. All saturating dimensionalities are much lower than the dimensionality of the image space.
Rings mark n*. Hover for values; click a legend entry to hide it.
Per-annotator agreement (BAPPS, PieAPP) or accuracy (NIGHTS test) at each N, unsmoothed. The orange line and band are the theoretical ceiling and its 95% CI.
Saturation point n*
Encoder
BAPPS Agr
n*
PieAPP Agr
n*
NIGHTS Acc
n*
Contrast Pyramid
.645
3
.647
2
.703
7
CORnet-S V1
.685
4
.701
6
.747
8
CORnet-S V2
.689
3
.712
5
.793
14
CORnet-S V4
.688
4
.714
8
.855
48
CORnet-S IT
.677
6
.702
14
.853
96
CORnet-S Multi
.688
3
.710
9
.859
96
Perceptual vs. frequency-space sparsity
Perceptual
DCT top-K / ch.
Encoder
N=2
N=6
K=2
K=10
K=20
K=200
Contrast Pyramid
.634
.637
.536
.574
.586
.627
CORnet-S V1
.666
.682
.552
.589
.615
.674
CORnet-S V2
.672
.685
.563
.608
.632
.686
CORnet-S V4
.667
.685
.564
.615
.636
.686
CORnet-S IT
.647
.669
.564
.609
.628
.674
CORnet-S Multi
.670
.686
.566
.612
.635
.684
A low saturating dimensionality could be explained by the sparsity of natural images in the frequency domain. To test this, we keep only the top-K DCT coefficients of every YUV channel and apply our observer model to the reconstructed images. Matching our N = 6 model requires roughly two orders of magnitude more dimensions in the DCT control. At the same sparsity (N = 6, K = 2, shaded), the DCT control is about 0.1 lower in agreement.
Task complexity shapes the representation the model needs
Encoding images with the contrast pyramid gives the lowest performance on all three datasets, so retinal representation alone can not fully account for human judgments. Low-level judgments are best supported by V1 to V4, and moving to IT reduces alignment with human choices. High-level judgments benefit from IT, and V1 and V2 are markedly lower. A model trained on BAPPS loses little when applied to PieAPP, and loses much more when applied to NIGHTS.
Interpreting the perceptual dimensions
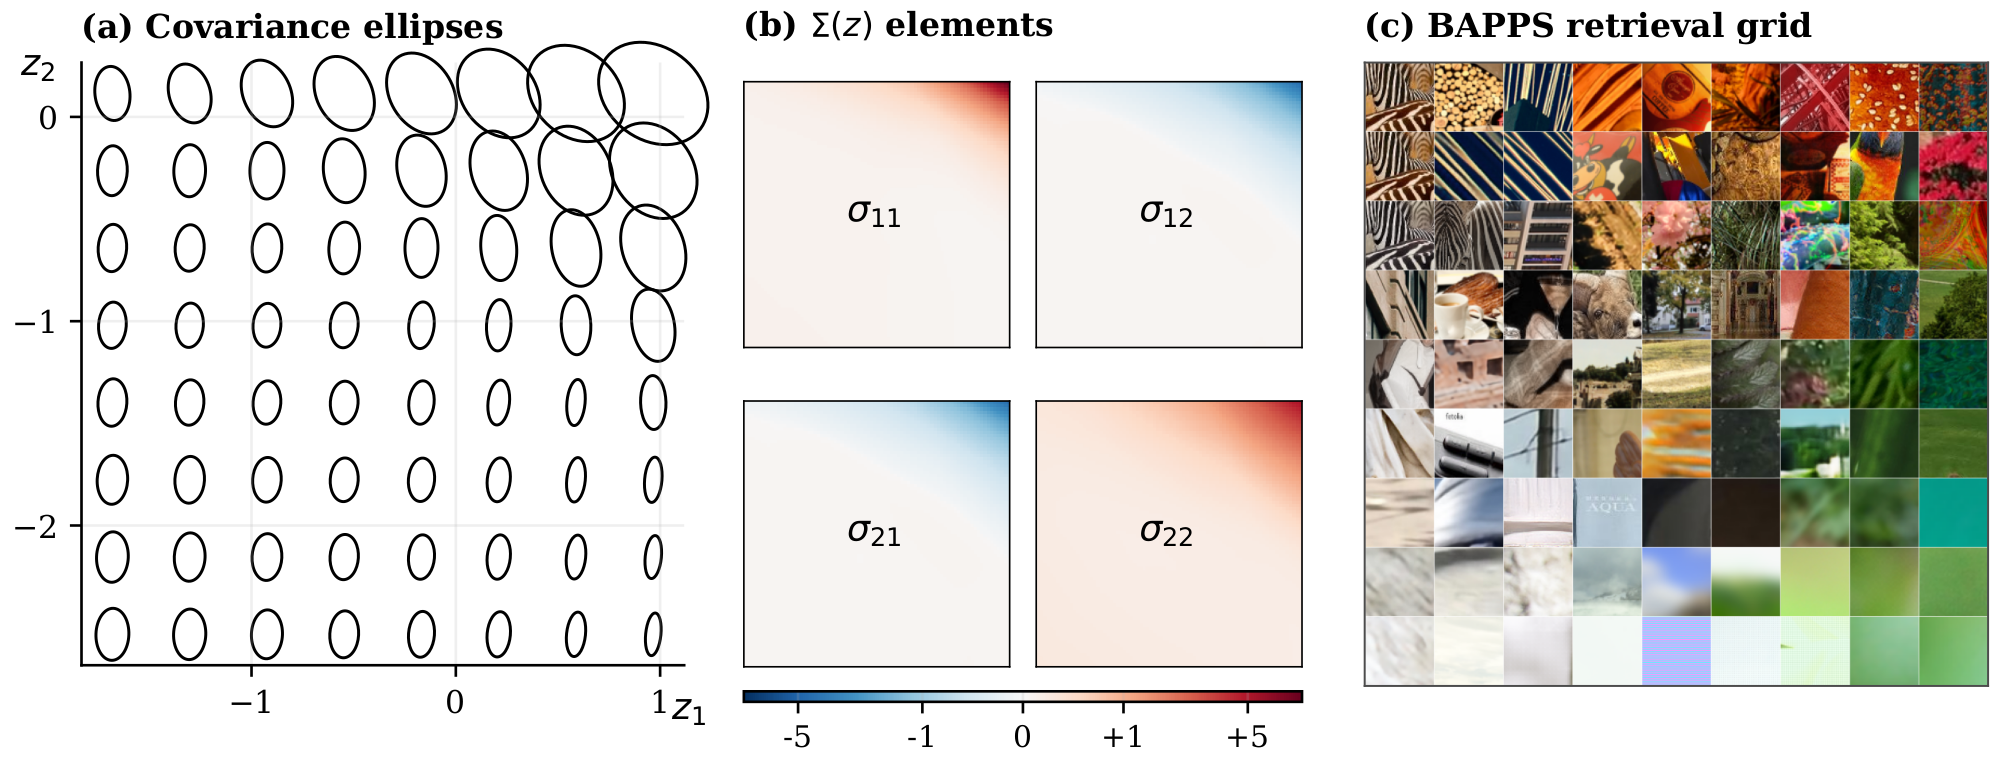
At N = 2 (CORnet-S Multi, BAPPS), the covariance field varies smoothly over the space, and the two dimensions are readable: z₁ encodes texture and spatial frequency and z₂ encodes color. These directions match classical distinctions in early vision, although they are learned purely from behavioral data. The image background of the demo above is the same space: smooth patches sit on one side of z₁ and textured patches on the other, and saturation and hue change along z₂.
(a) Covariance ellipses over the two learned dimensions on an 8 × 8 grid (log scale, 2σ). (b) The four elements of Σ over the 2D space. (c) BAPPS images arranged by z₁ and z₂.
The same kinds of axes appear on PieAPP and NIGHTS
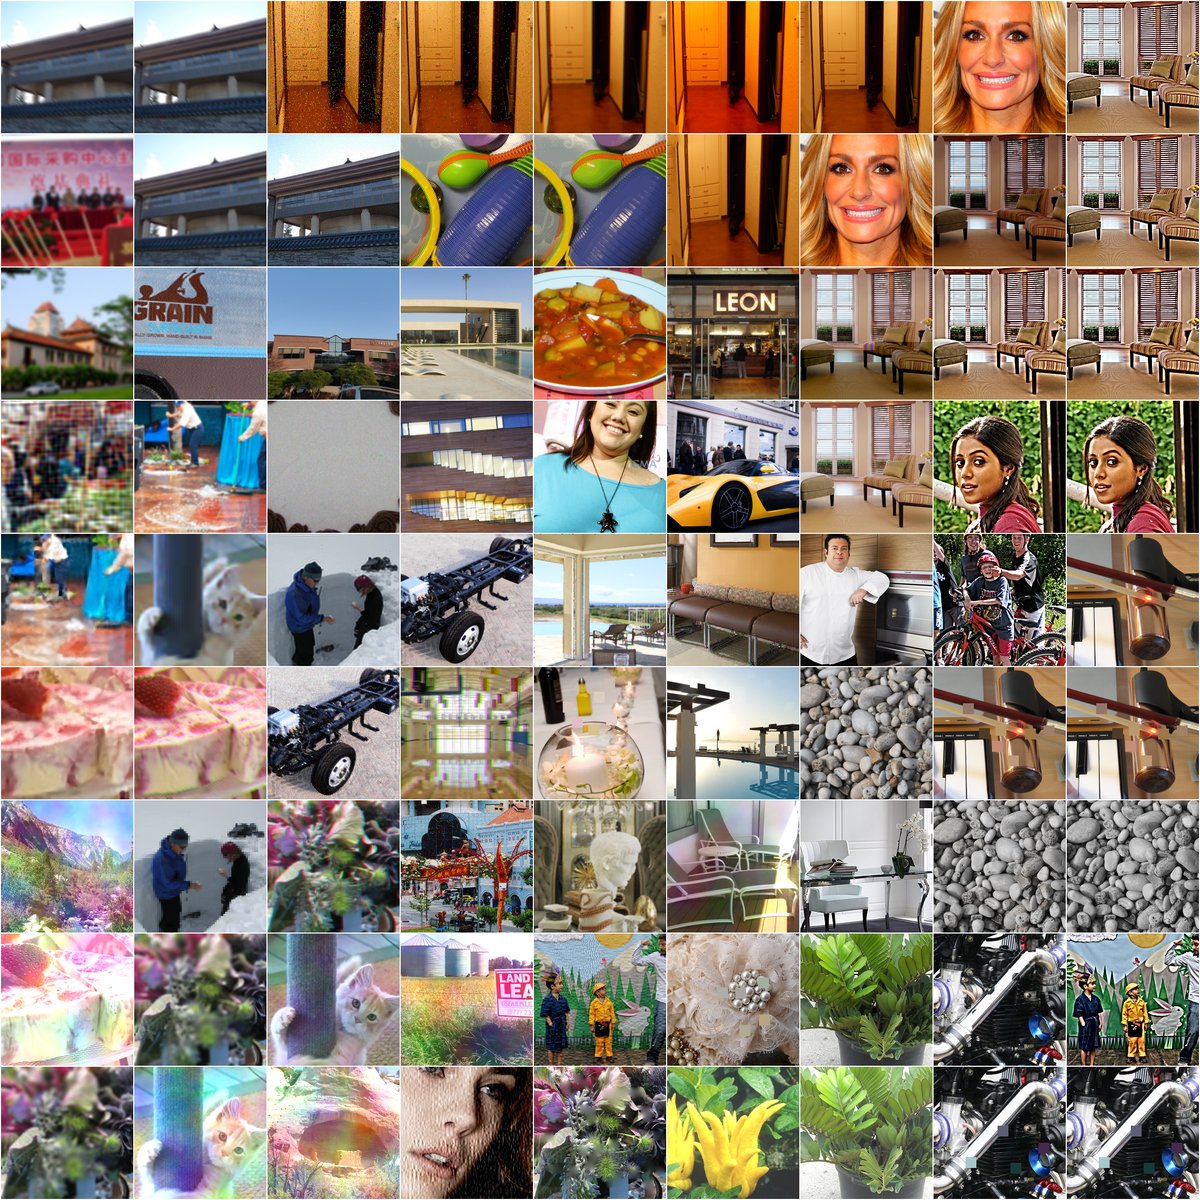
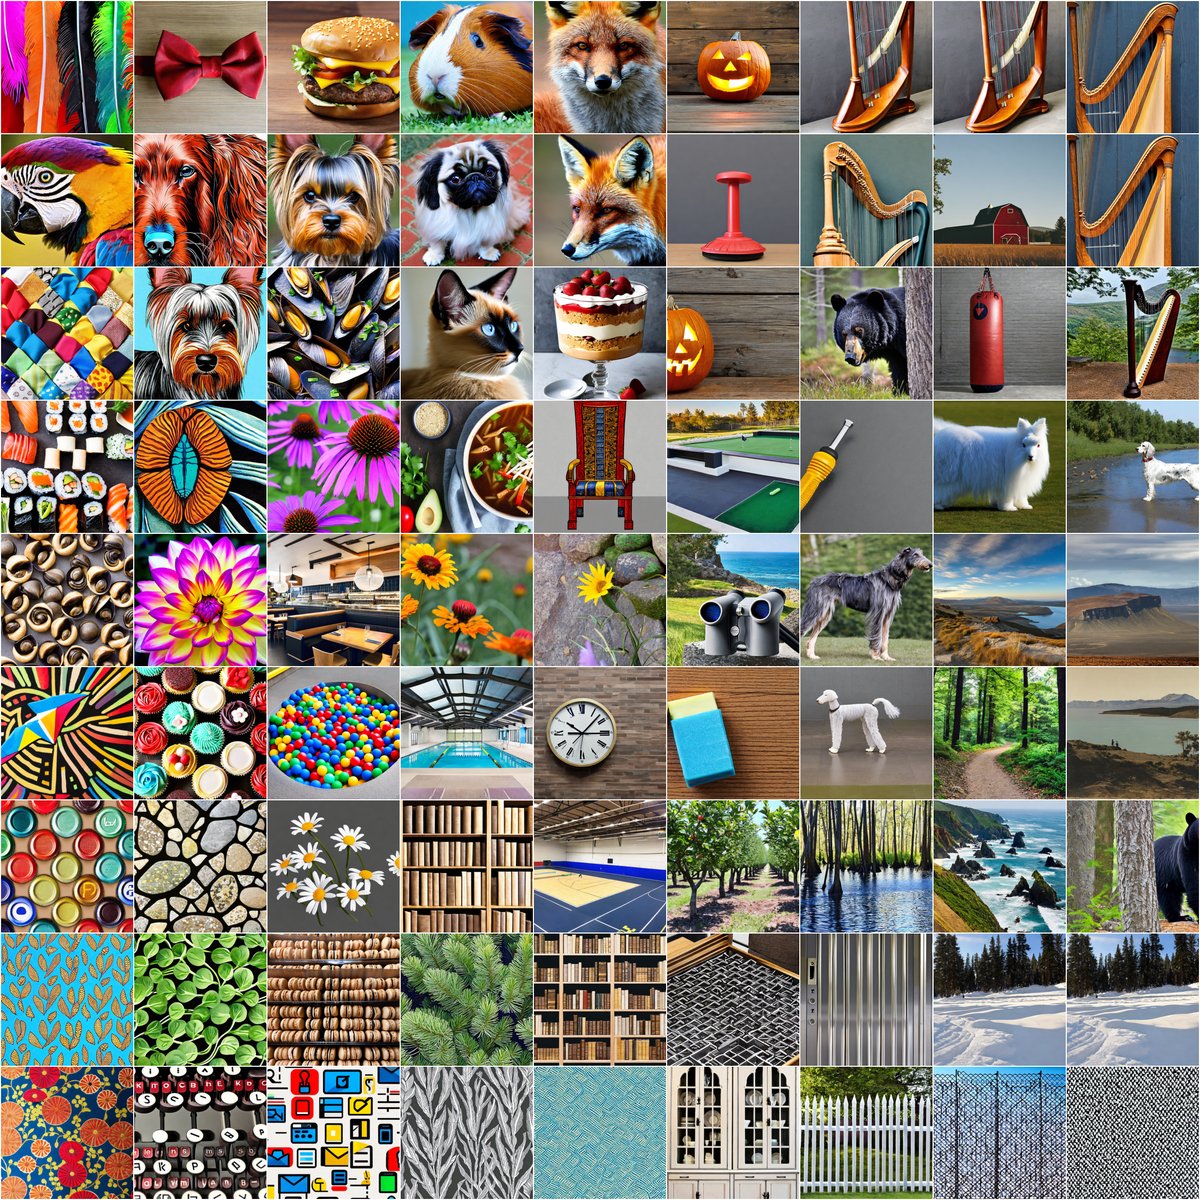
At N = 2, both datasets recover dimensions similar in spirit to those in BAPPS. On PieAPP, the vertical axis ranges from large-scale repetitive structure (architectural corridors, doorways) at the top to fine cluttered texture (gravel, mechanical parts) at the bottom, and the horizontal axis ranges from warm, colorful outdoor scenes to predominantly muted indoor objects. On NIGHTS, the vertical axis tracks scene multiplicity, with single foreground subjects (a fox, a hamster, a harp) at the top and multiple repeating elements (fences, radiator stripes) at the bottom; the horizontal axis tracks color, with more colored images on the left and near-monochromatic images on the right.
PieAPP, N = 2
NIGHTS, N = 2
Each cell of the 9 × 9 grid is an image from the dataset situated near that point in the learned space (CORnet-S Multi).
Higher dimensions read from different visual areas
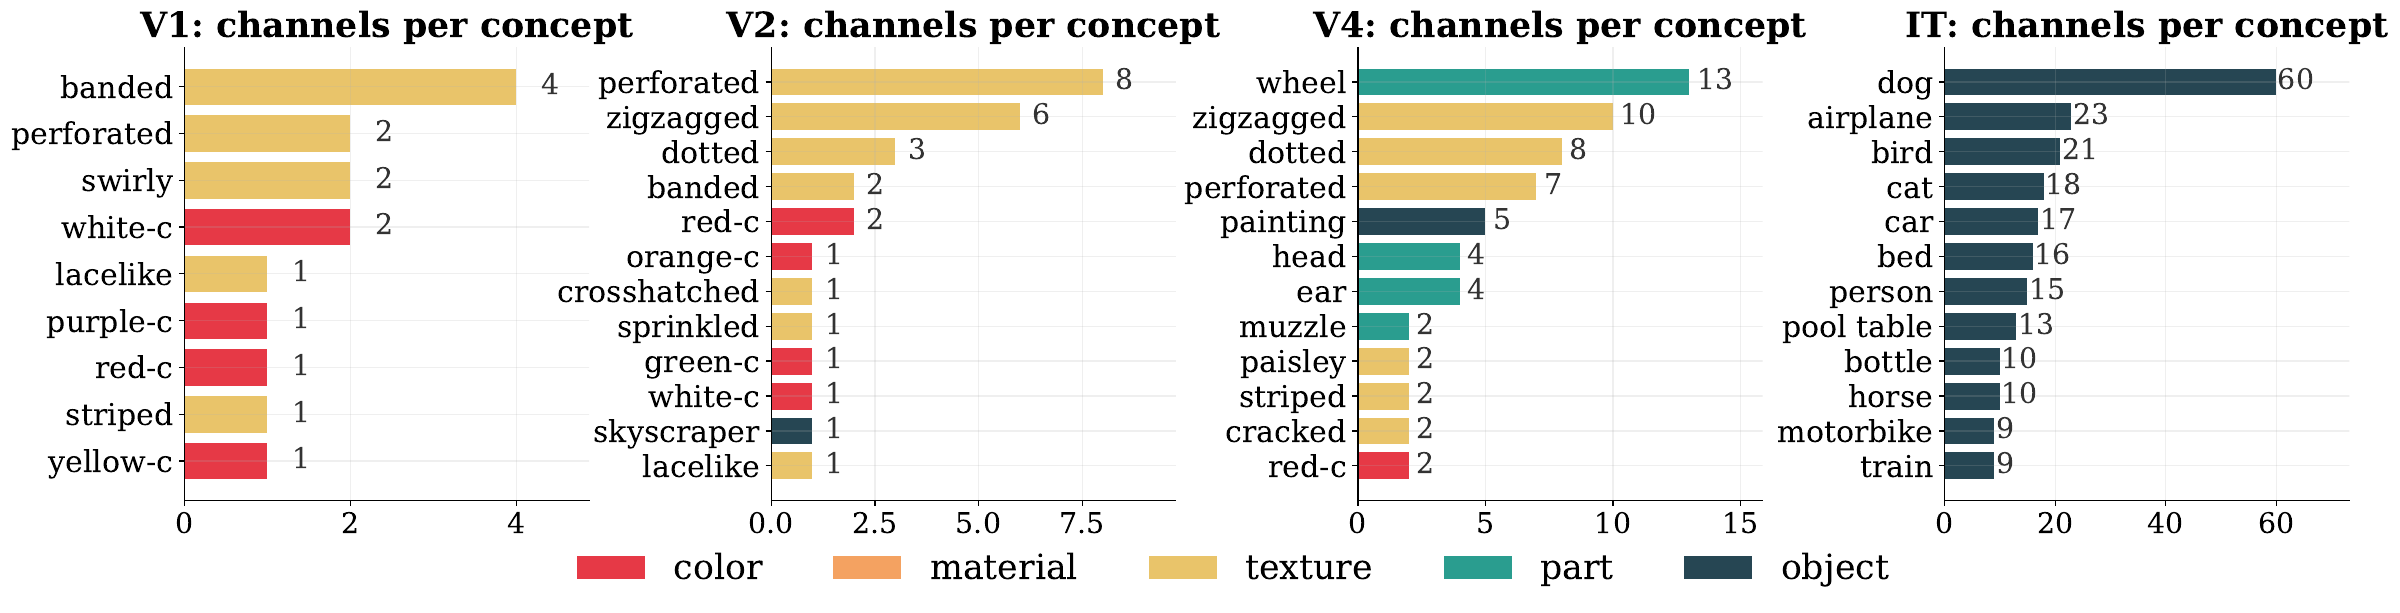
At larger N, each dimension carries finer meaning that is hard to describe in words. Because the perceptual space is an affine transformation of the encoder space, each perceptual dimension is a weighted sum of encoder channels. We first label each CORnet-S channel with the BRODEN concept it selects for. V1 channels predominantly select for color and low-level texture; V2 is dominated by texture; V4 begins producing parts and object fragments (wheel, head, ear); IT is dominated by whole objects.
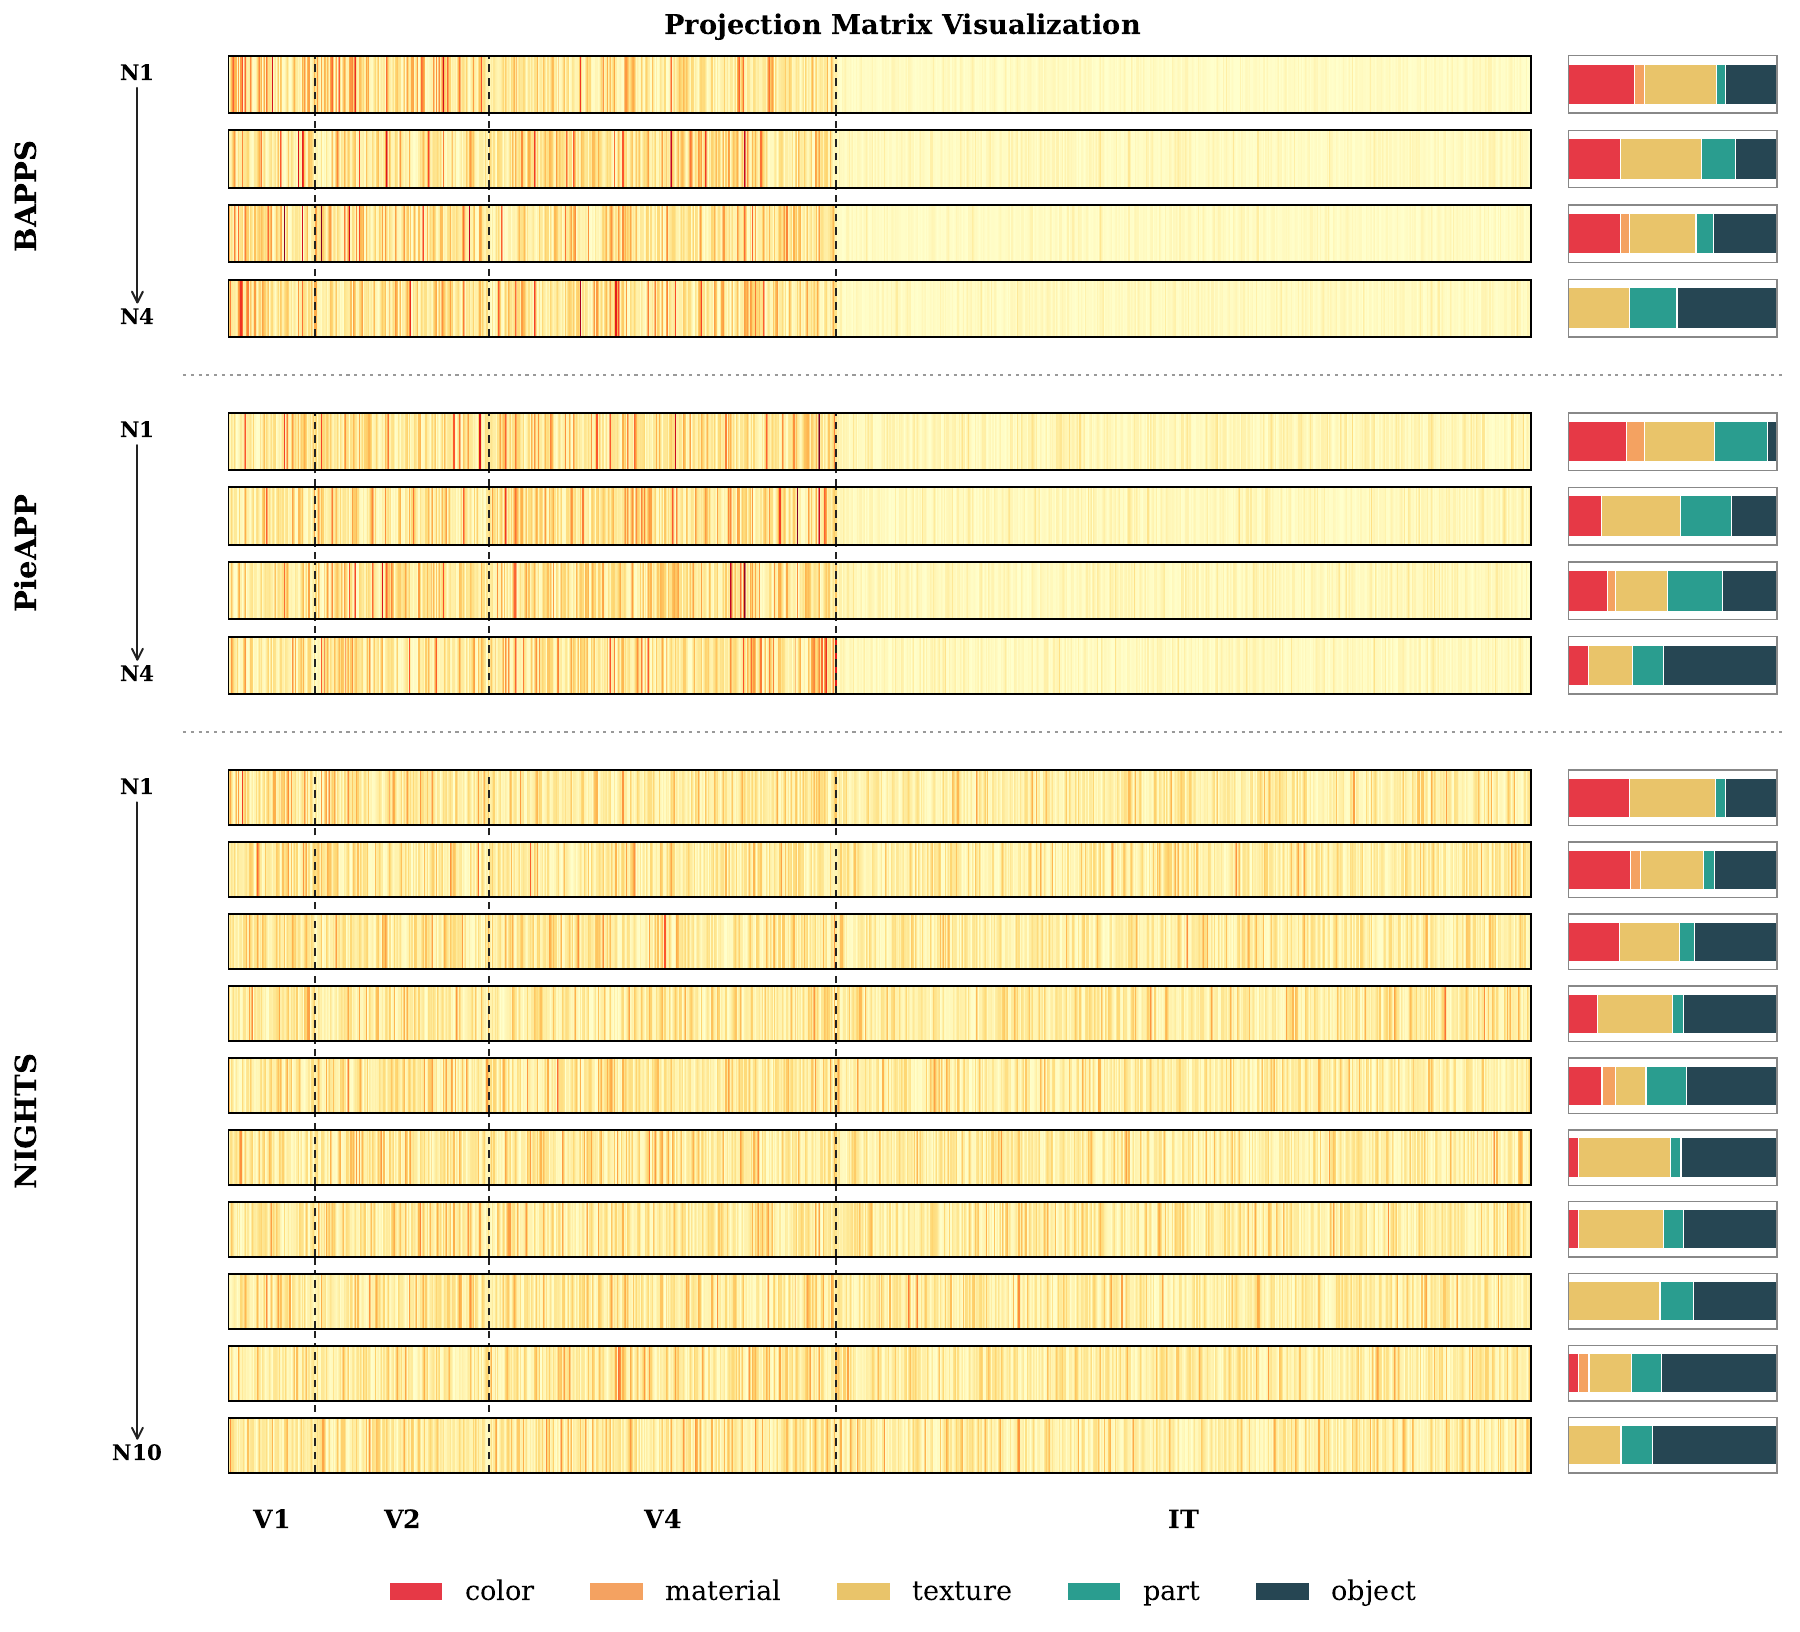
The rows of the learned projection matrix W then show which channels each perceptual dimension reads from. BAPPS and PieAPP models do not rely on area IT, whose contribution becomes significant for NIGHTS. BAPPS and PieAPP dimensions remain dominated by color and texture, while NIGHTS dimensions reach part- and object-level semantics. The level of the ventral stream recruited by the perceptual space tracks the semantic level of the dataset.
Row-normalized projection magnitudes |Wk,j| for BAPPS (N = 4), PieAPP (N = 4) and NIGHTS (N = 10). Each row is one perceptual dimension, each column one of the 960 CORnet-S Multi channels; dashed lines separate V1, V2, V4 and IT. The bar on the right of each row shows the BRODEN category mix of its top-20 channels.
Dimensions are largely independent
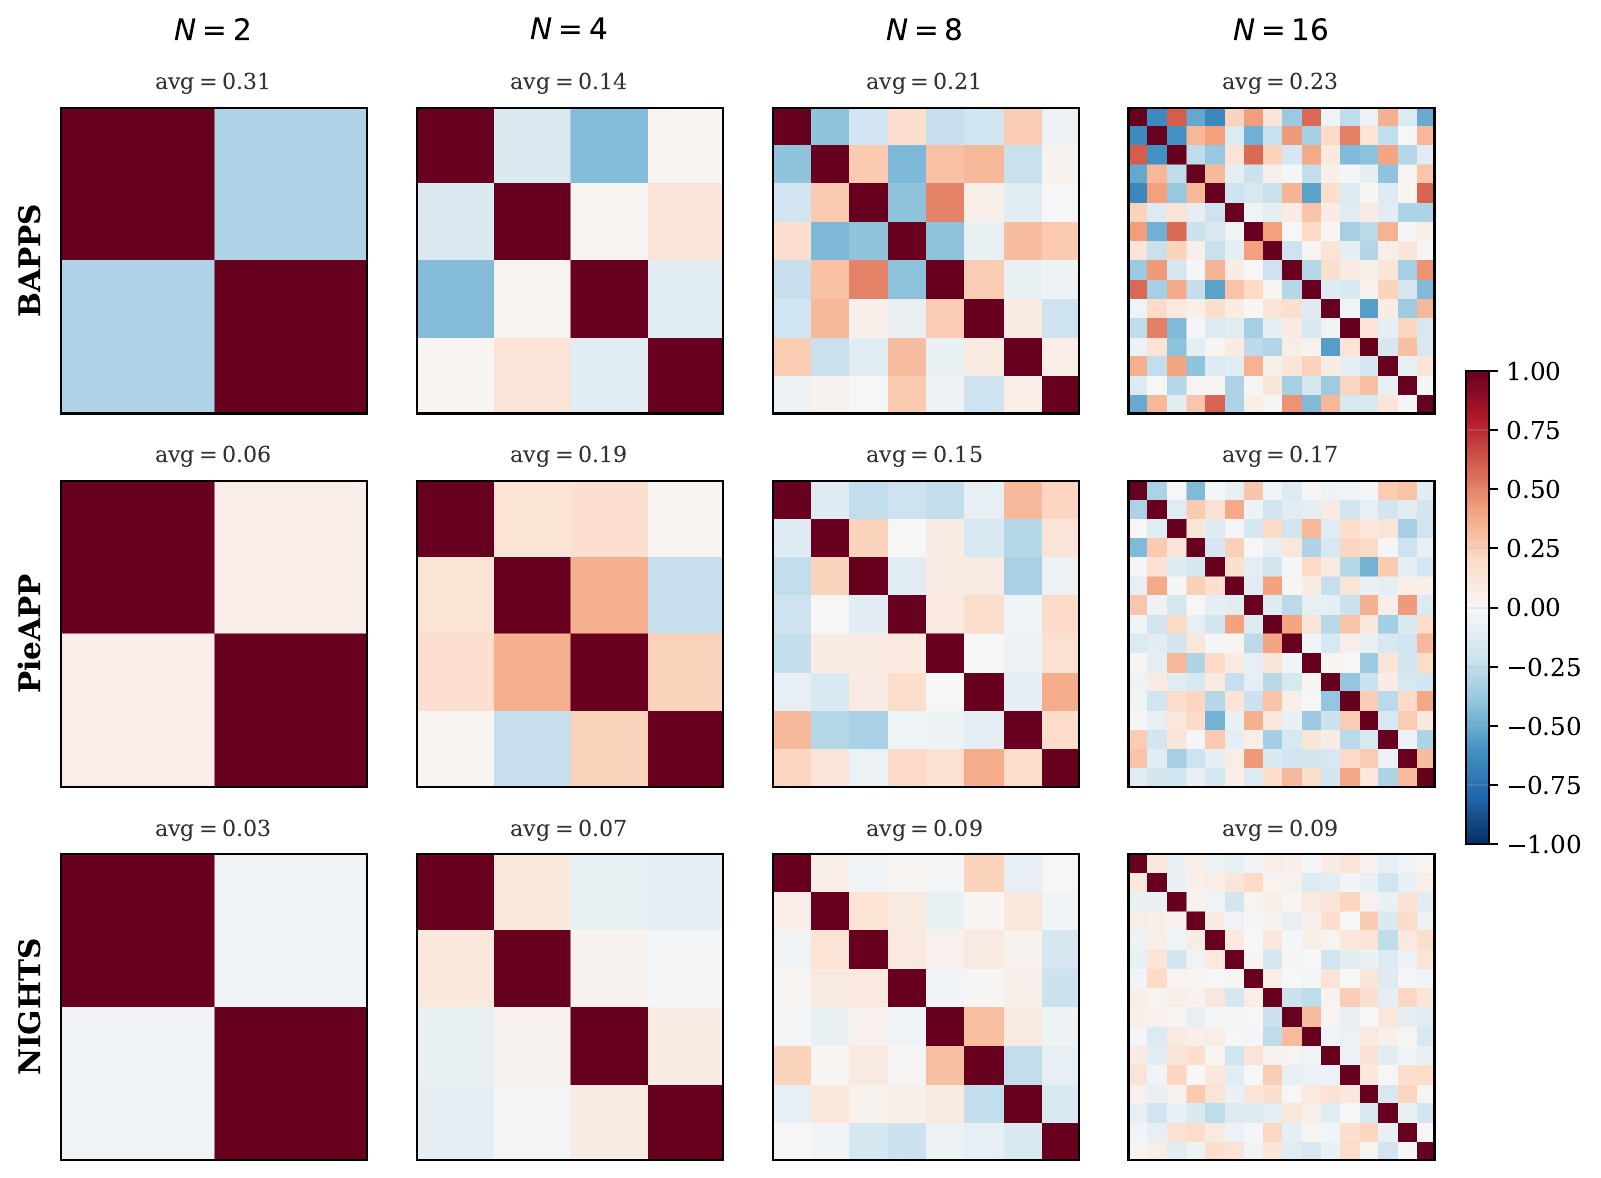
For every dataset and every N, we compute the Pearson correlation between each pair of learned dimensions over the images of the dataset. The average off-diagonal correlation stays below 0.25.
Separable and integral dimensions
The learned Minkowski exponent p is lower on BAPPS than on NIGHTS for the best-performing model of each dataset (p = 1.09 with CORnet-S V2 on BAPPS, p = 1.51 with CORnet-S Multi on NIGHTS). Low-level judgments are better explained by separable dimensions (p = 1) and high-level judgments by integral dimensions (p = 2).
Pairwise Pearson correlation between learned dimensions. Rows: BAPPS, PieAPP, NIGHTS. Columns: N = 2, 4, 8, 16.
Beyond triplet 2AFC
The observer model also extends to other psychophysical paradigms, such as 2AFC tasks where the reference image is not shown and subjective rating tasks. On rating-based IQA datasets, where each image carries a mean opinion score, we treat the expected Minkowski distance between an image's distribution and that of its reference as the perceptual score. We fit the model (CORnet-S Multi, N = 24) on the MOS labels of KADID-10k and evaluate it zero-shot on TID2013, CSIQ and LIVE.
Method
TID2013
CSIQ
LIVE
Ours (CORnet-S Multi)
0.860 / 0.870 / 0.666
0.946 / 0.948 / 0.796
0.937 / 0.927 / 0.781
MILO
0.876 / 0.876 / 0.692
0.959 / 0.942 / 0.817
0.953 / 0.913 / 0.817
TOPIQ-FR
0.917 / 0.921 / 0.744
0.967 / 0.964 / 0.838
0.898 / 0.901 / 0.717
CVVDP
0.853 / 0.864 / 0.672
0.896 / 0.883 / 0.728
0.917 / 0.902 / 0.766
DreamSim
0.809 / 0.830 / 0.612
0.932 / 0.941 / 0.768
0.899 / 0.902 / 0.729
PieAPP
0.850 / 0.846 / 0.652
0.845 / 0.829 / 0.666
0.925 / 0.915 / 0.765
DISTS
0.708 / 0.755 / 0.521
0.930 / 0.938 / 0.764
0.955 / 0.954 / 0.814
LPIPS-VGG
0.670 / 0.749 / 0.497
0.883 / 0.905 / 0.697
0.943 / 0.945 / 0.791
SSIM
0.710 / 0.702 / 0.511
0.813 / 0.804 / 0.613
0.927 / 0.910 / 0.762
PSNR
0.687 / 0.677 / 0.496
0.809 / 0.816 / 0.599
0.925 / 0.924 / 0.756
SRCC / PLCC / KRCC, higher is better. Bold = best, underline = second and third best, ranked per dataset and metric. Numbers are from the appendix of the paper.
Our model often ranks among the top three. Across the three triplet datasets and the three rating datasets, it has the best average rank among the nine baselines that appear in both comparisons, and it ranks in the top three on five of the six datasets.
Method
BAPPS
NIGHTS
PieAPP
TID2013
CSIQ
LIVE
Avg. rank
Ours (CORnet-S Multi)
1
3
3
3
3
4
2.83
DreamSim
2
1
1
6
4
9
3.83
DISTS
3
2
4
8
5
1
3.83
TOPIQ-FR
4
6
5
1
1
10
4.50
MILO
8
9
7
2
2
2
5.00
LPIPS
5
4
6
10
7
3
5.83
CVVDP
6
5
8
4
6
8
6.17
PieAPP
10
7
2
5
8
6
6.33
SSIM
7
8
9
7
9
5
7.50
PSNR
9
10
10
9
10
7
9.17
Per-dataset rank of each method. BAPPS and PieAPP use per-annotator agreement, NIGHTS uses accuracy, and TID2013, CSIQ and LIVE use SRCC. Lower is better.
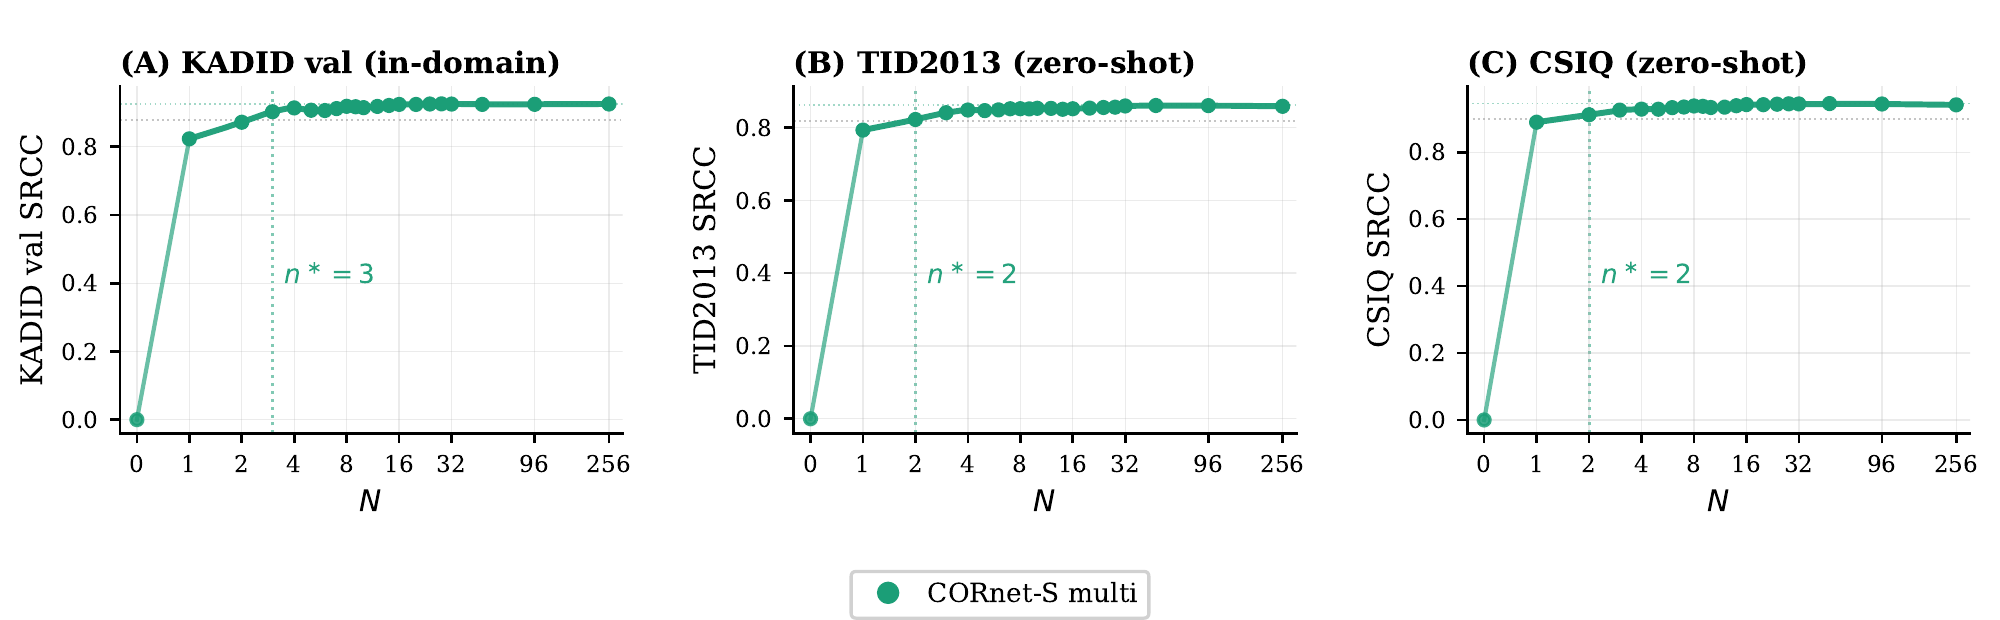
The saturating dimensionality stays low on rating data. SRCC saturates at n* = 3 on KADID-10k and at n* = 2 on TID2013 and CSIQ, all of which consist of traditional low-level distortions.
SRCC at each N for the KADID-10k-fitted model on (A) KADID-10k val, (B) TID2013 (zero-shot) and (C) CSIQ (zero-shot). The vertical band marks n*.
Citation
@inproceedings{zhao2026observer,
  title     = {Multidimensional Observer Model and Perceptual Dimensions
               of Human Image Quality Assessment},
  author    = {Zhao, Sheng and Lin, Weikai and Zhu, Yuhao},
  booktitle = {Advances in Neural Information Processing Systems (NeurIPS)},
  year      = {2026}
}